- 高次諧波的產生。
- 互調失真 (當兩個輸入頻率在輸出端產生第三個頻率時)。
- 電流整流(當樣品在一個方向的電阻/阻抗與另一個電流方向的電阻/阻抗不同時)。
- 疊加衰減(輸入頻率的疊加不會在輸出中保留)。
- 及時繪製3D Nyquist(或者Argand圖)。
- 及時繪製Bode圖。
- 在給定頻率下隨時間變化的阻抗演示。
- 差分圖可以看到阻抗隨時間產生的微小變化。
|
包括哪些?
|
 |
|
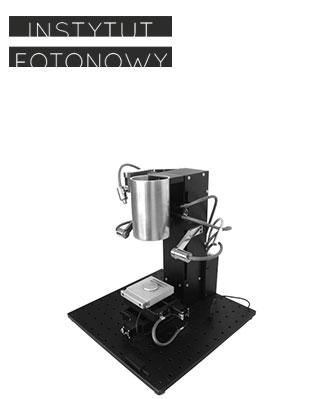
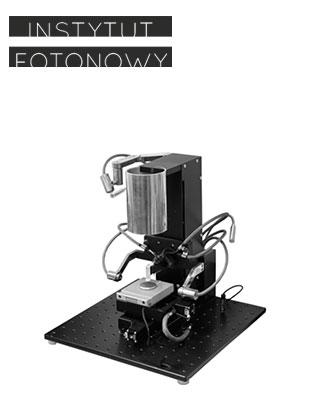
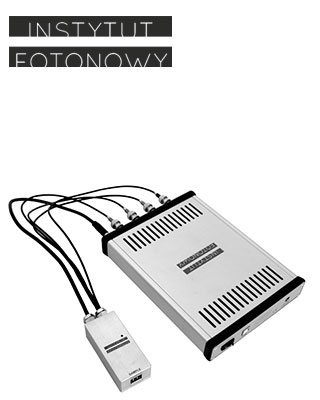
用於電化學測量的阻抗相機 阻抗相機結合電化學測頭和樣品室,可作為電化學樣品的專用測量裝置,以避免環境光線和外部電磁場的干擾。 |
 |
 |
 |
| 示範結果 阻抗相機軟體的介面非常簡潔,不需要進行培訓。 下面所展示的是對一個並聯RC電路進行測量所獲取的結果,其中電阻依賴於塗層照明強度。 |
|
| 右圖是Nyquist曲線(或者Argand圖),顯示了在不同時間頻率範圍內,測量阻抗所得到的實部和虛部。 我們可以看到,在測量序列中間部分電阻增加,阻抗半圓的直徑增加。 綠色部分是在時間上選擇相同頻率的測量點。 只改變電容的情況下,在C電路中,所有的半圓大小相同,但給定頻率點的位置會沿著一個圓進行移動。 |
 |
| 單幀3D Nyquist(Argand圖)曲線 |  |
| 振幅隨時間的變化的Bode |  |
| Bode時間相位圖 |  |
- 序列中的幀數:不限。
- 一幀中的頻率數:不限。
- 產生電位信號的範圍:-1 ~ 1 V。
- 測頭類型: 基本型 (雙電極)/電化學 (三電極)。
- 取樣率: 1.22 kHz ÷ 10 MHz、
- 電流範圍:10 mA、1 mA。
- 頻率範圍:1 mHz ÷ 1 MHz。
- 電流範圍:1 mA、100 μA、10 μA、1 μA、100 nA、10 nA。
- 頻寬範圍:2.5 MHz、1.3 MHz、300 kHz、35 kHz、3kHz、300 Hz。
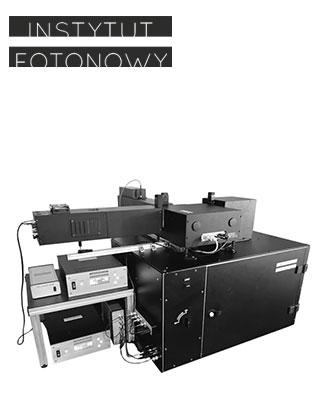
The instrument is designed for the Time-Resolved Impedance Spectroscopy. Typically, when Impedance Spectroscopy measurements are performed, impedance of a sample is measured subsequently for each frequency applied. However, if a dynamically changing sample is examined, its properties may significantly change during the frequency sweep. A resulted impedance spectrum might be hard to interpret in such a case. The Time-Resolved Impedance Spectroscopy Analyzer takes an entire frequency spectrum with selectable sweep limits in a single shot. All the frequencies are handled at the same time. To observe the time evolution of a sample, many frames may be recorded with a given time interval. The instrument enables to investigate the dynamics of different types of samples, such as electrochemical sensors, materials that changes its properties when exposed to a given agent (light, temperature, catalyst, etc.) and others.
Instrument measures current flowing through the sample and voltage on the sample in response to a voltage signal generated as a superposition of frequencies.
Classic Impedance Spectroscopy (IS) or Electrochemical Impedance Spectroscopy (EIS) assumes that a sample is linear and time invariant (LTI).
However, most electrochemical samples are notoriously both: non-linear and have memory.
Non-linear effects
Thus you can explore the following non-linear effects in your sample:
- Higher harmonics generation,
- Intermodulation (when two input frequencies result in a third frequency at the output),
- Electric current rectification (when resistance/impedance of a sample in one direction differs from the resistance/impedance in the other direction of current flow),
- Superposition breakdown (superposition of input frequencies is not preserved in the output).
Sample memory effects
- Time evolution of impedance spectra of a sample under stable ambient conditions reveals if previous measurements affect the next.
Presentations of results
The measurement results are presented in:
- 3D Nyquist (Argand) plot in time,
- Bode plots in time,
- Time evolution plot of an impedance at a given frequency contained in generated signal,
- Difference plots to observe relative changes in time,
- Plots with raw current and raw voltage frames collected.
The Time-Resolved Impedance Spectroscopy Analyzer is ideal to observe the real time development of impedance of electrochemical sensors. This type of measurements is complementary to static photocurrent/photovoltage measurements performed, for example, with Photoelectrochemical (PEC) Measurement Station:.
|
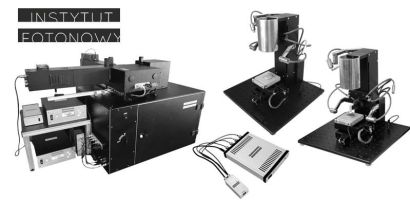
device modules
|
|
|
Time-Resolved Impedance Spectroscopy Analyzer for electrochemical measurements |
|
|
|
| exemplary results The measurement results shown below are obtained for a parallel RC circuit where the resistance was depends on the oscillating illumination intensity. |
|
| Nyquist (or Argand) plot presents a real and imaginary part of impedance measured for range of frequencies at various times. One can see the impedance value increases in the middle of the measuring sequence and the impedance semicircles grow in the diameter. The green color selects the same frequency measurement points in time. If only capacitance was changed, in the RC circuit, all semicircles would be the same size but position of given frequency points would move along a circle. |
|
| A single frame 3D Nyquist (Argand) plot. | |
| Bode plots amplitudes in time. | |
| Bode plots phases in time. | |
Time-Resolved Impedance Spectroscopy Analyzer
- Number of frames in a sequence: unlimited,
- Number of frequencies in a frame: unlimited,
- Range of generated potential signal: -1 ÷ 1 V,
- Measurement Head types: Basic (Two-Electrode)/Electrochemical (Three-Electrodes),
- Sampling rates: 1.22 kHz ÷ 10 MHz,
Basic Head
- Current ranges: 10 mA, 1 mA,
- Frequency ranges: 1 mHz ÷ 1 MHz,
Electrochemical Head
- Current ranges: 1 mA, 100 μA, 10 μA, 1 μA, 100 nA, 10 nA,
- Bandwidth ranges: 2.5 MHz, 1.3 MHz, 300 kHz, 35 kHz, 3kHz, 300 Hz,